Guide
How to Tie Your GRC Efforts to Revenue

Introduction

Forward-thinking executives are discovering that GRC programs, when properly positioned, can become powerful revenue drivers rather than necessary overhead. The organizations leading this transformation are systematically converting compliance obligations into competitive advantages, unlocking new markets, and accelerating customer acquisition through strategic risk management.
From cost center to value creator: transforming the perception of GRC
Historically, GRC functions have been viewed primarily as compliance overhead, necessary expenses to meet regulatory requirements and avoid penalties. This perspective often positions GRC teams as a cost center focused on risk avoidance rather than value creation. However, this perception has begun to shift as organizations recognize the strategic potential of well-designed GRC programs.
The transition from cost center to value creator depends on several key factors:
The ability to land and expand new markets: When GRC is aligned with business goals, obtaining compliance with new regulatory frameworks at scale can accelerate your ability to unlock market access and rapidly grow your business.
Leadership and incentives: Leadership teams that tie compensation and incentives to both risk management and performance metrics tend to foster balanced approaches to risk-taking and compliance.
Technology improvements: Organizations that invest in integrated GRC platforms often streamline processes, reducing inefficiencies while providing real-time insights.
These improvements, combined with a risk-focused culture that encourages reasonable risk-taking, help transform GRC from a defensive function into a strategic asset.
Balancing revenue focus with appropriate risk management
While aligning GRC with revenue objectives creates business value, an excessive focus on revenue generation might undermine the fundamental functions of GRC. Organizations must find the right balance between growth and risk management to ensure sustainable success.
Understanding the tension between these objectives is crucial:
Risk-taking vs. caution: Revenue growth typically rewards risk-taking and innovation, while risk management emphasizes caution and control.
Sales and compliance: Sales incentives often encourage closing deals quickly, while compliance requirements may introduce processes that extend sales cycles.
Product development and security: Product development teams frequently push for rapid releases, while security reviews may identify issues requiring remediation.
Inquiry: Interview employees to confirm their understanding of policies and procedures.
Governance structures can help manage these tensions effectively:
Risk appetite statements: Clear statements approved by executive leadership establish boundaries for acceptable risk-taking.
Escalation paths: Defined paths for risk decisions beyond thresholds ensure appropriate oversight of significant issues.
Balanced scorecards: Including both performance and risk metrics creates accountability for both dimensions.
Integrated decision processes support balanced outcomes. By considering both threats and opportunities, risk assessment frameworks offer a comprehensive evaluation of initiatives. To prevent disruptions later in development, organizations can implement stage-gate processes for new ventures that incorporate risk and compliance checkpoints throughout. When performance metrics and risk indicators are continuously monitored, teams can quickly adjust course as needed.
Direct and indirect revenue impacts of GRC activities
GRC activities can affect organizational revenue in multiple ways, ranging from obvious connections to more subtle influences. Understanding these various impacts helps organizations better articulate the value of their GRC investments.
Direct revenue impacts
Indirect revenue impacts
Strategic revenue impacts
Common barriers to connecting GRC with revenue objectives
Despite the potential benefits, many organizations struggle to establish clear connections between GRC activities and revenue objectives. Several barriers appear to prevent effective alignment.
Organizational silos
- The separation of GRC functions from business operations limits communication and collaboration
- Lack of visibility into how GRC work impacts revenue-generating activities when GRC teams operate independently from sales, marketing, and product development teams
- The absence of shared objectives between risk management and business development teams can result in competing priorities rather than complementary efforts
Measurement challenges
- Traditional metrics for GRC success often focus on risk reduction rather than business growth
- Difficulty in quantifying the benefits of GRC activities, such as incidents prevented or maintained reputation, in financial terms
- Without clear metrics connecting GRC efforts to revenue impacts, business leaders might struggle to see the value proposition
Resource constraints frequently limit the ability of GRC teams to pursue strategic initiatives. When compliance budgets are determined based on regulatory requirements rather than business potential, GRC functions may lack the resources needed to support growth objectives. Additionally, many GRC professionals receive limited training in business operations and financial analysis, making it challenging for them to articulate the revenue implications of their work.
Strategic frameworks for revenue-aligned GRC
Risk-based prioritization of GRC investments
Effective allocation of limited GRC resources requires a risk-based approach that considers potential revenue impacts. Organizations can benefit from moving beyond compliance-driven prioritization toward models that emphasize business value protection and creation.

A methodology for this approach might begin with a comprehensive risk assessment across the organization, considering both compliance requirements and business objectives. For each identified risk, teams can estimate the potential revenue impact based on factors such as market access, customer trust, operational disruption, and competitive positioning.
Quantitative analysis may help determine the expected financial impact of each risk. This might involve calculating the probability of occurrence multiplied by the potential revenue loss, then factoring in the expected effectiveness of proposed controls. This calculation provides an expected value for each risk mitigation investment, allowing for comparison across different initiatives.
Example

Consider a scenario where a company faces a data breach risk with a 15% annual probability of occurrence and potential revenue loss of $2 million. Without additional controls, the expected annual loss equals $300,000 (0.15 × $2,000,000).
A proposed cybersecurity upgrade costing $150,000 could reduce the probability to 5%, lowering the expected annual loss to $100,000 (0.05 × $2,000,000). The net benefit of this investment would be $50,000 annually ($300,000 – $100,000 – $150,000), yielding a positive return on the risk mitigation investment.
Qualitative factors should supplement these quantitative measures. Some risks might threaten strategic business opportunities that are difficult to quantify but represent significant growth potential. Others might affect brand reputation or customer trust, which influence long-term revenue but resist simple financial calculation.
Example

Regulatory scrutiny often intensifies following security incidents. Compliance audits become more frequent and demanding. Future business expansion into regulated markets becomes more challenging when regulators view the organization as having a history of security lapses. Similarly, strategic partnerships can suffer when potential collaborators perceive elevated security risks. Technology integrations that could drive innovation get delayed or canceled. Joint ventures become harder to negotiate when partners question data handling capabilities.
These qualitative impacts compound over multiple years, creating value destruction that extends far beyond the initial financial calculation.
A portfolio approach to GRC investments tends to yield the best results, balancing resources across risks with different profiles. Some investments might focus on protecting current revenue streams, while others support future growth opportunities. Regular review and adjustment of this portfolio based on changing business conditions and risk landscapes helps maintain alignment with revenue objectives.
Mapping GRC activities to revenue functions and measuring value beyond risk reduction
Creating clear connections between specific GRC activities and revenue streams requires a systematic methodology, complemented by metrics that demonstrate broader business value. Later in this section, we’ll provide a methodology framework to give you practical steps on how to put it into practice.
For each revenue-generating function, GRC professionals can identify relevant intersection points:
Sales processes
Compliance activities ensure contracts meet legal standards and protect against fraud risks.
Product development
Risk assessments help prevent costly recalls or security vulnerabilities that could damage customer trust.
Marketing activities
Benefit from compliance reviews that prevent deceptive practices or privacy violations.
Business enablement metrics show how security initiatives support growth and customer trust. Revenue impact measurements demonstrate how GRC investments protect existing revenue streams by preventing downtime or enabling compliance in new markets. Market penetration rate tracking highlights the ability to enter new markets due to enhanced compliance frameworks. Customer acquisition and retention rates often improve with stronger security postures, providing tangible evidence of GRC’s contribution to business growth.
Operational efficiency metrics emphasize cost savings and process improvements:
Establishing key performance indicators (KPIs) that link GRC activities to financial outcomes provides ongoing validation of the value created. These metrics help demonstrate how GRC activities support uninterrupted business operations, customer retention, and market expansion.
Hyperproof’s automated evidence collection capabilities accelerate this process by connecting directly to service applications like AWS, Azure, and GitHub to automatically gather compliance documentation. This automation frees GRC teams to focus on strategic alignment rather than manual evidence gathering, strengthening connections between compliance activities and business outcomes.
GRC-Business Function Alignment Workshop Framework

To operationalize this revenue-focused approach, organizations need structured methodologies that bridge the gap between GRC activities and business outcomes. The following workshop framework has proven effective across multiple industries for identifying high-impact alignment opportunities.
Purpose
Facilitates cross-functional collaboration to identify specific ways GRC activities can support revenue-generating business functions.
When to use
During annual planning, when launching new GRC initiatives, or when seeking to improve business alignment of security and compliance programs.
Workshop preparation
1. Schedule a 2-3 hour session with representatives from:
2. Prior to the workshop, ask participants to:
Workshop agenda
1. Setting the context (15 minutes)
2. Business function deep dive (30 minutes per function)
Each function presents:
3. Mapping exercise (60 minutes)
Using the matrix below, identify specific GRC activities that could:
4. Action planning (45 minutes)
|
Business function |
Key objectives |
Compliance requirements |
GRC support opportunities |
Expected business impact |
|---|---|---|---|---|
|
Sales |
||||
|
Product Development |
||||
|
Marketing |
||||
|
Customer Support |
For each identified opportunity:
Post-workshop follow-up
- Document all identified opportunities and action plans
- Share with participants and executives
- Schedule a 30-day check-in to review progress
- Conduct quarterly reviews to assess business impact
Implementation tips
Quantifying the financial impact of GRC
Calculating return on investment for GRC initiatives

Forward-thinking organizations transform compliance requirements from potential barriers into strategic opportunities for market expansion and customer acquisition. This approach reframes regulatory requirements as enablers of business growth rather than constraints.
Accelerated market entry through built-in compliance represents a key advantage:

Get a jumpstart with Hyperproof
Hyperproof’s Jumpstart feature supports this market expansion by helping organizations assess how their current frameworks align with new compliance requirements they might need to implement for different markets and quickly gauge the work needed to become compliant. You can also implement new frameworks with a few clicks and crosswalk controls between programs, reducing duplicative work and manual processes. Jumpstart accelerates preparation for entering new regulated industries or geographies with unique compliance standards.
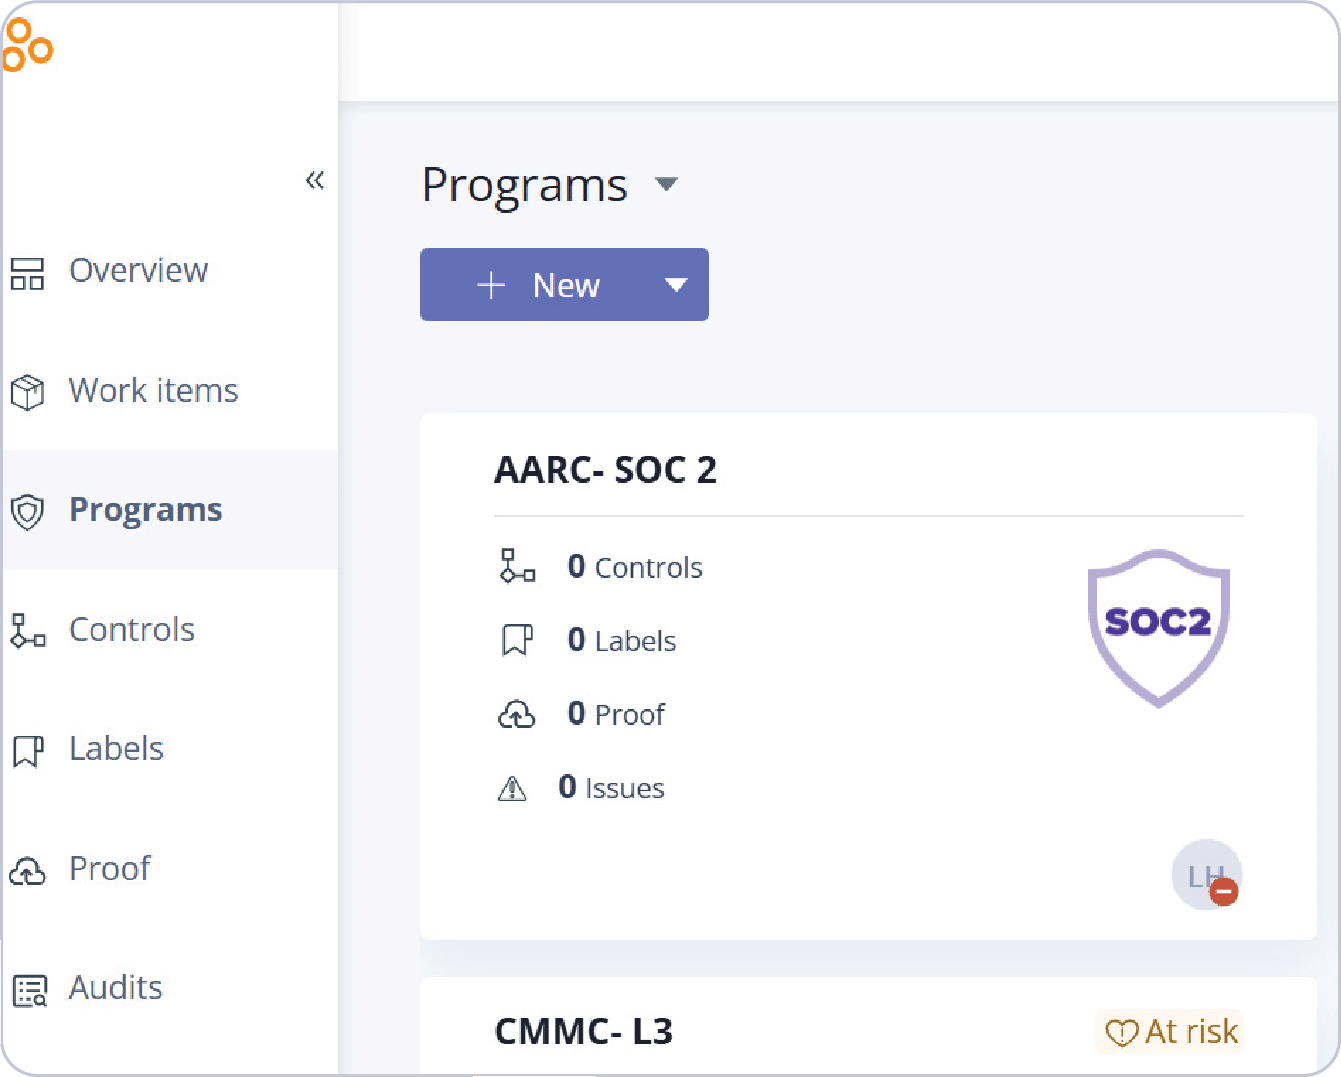
Setting up a jumpstart in Hyperproof is simple:
Select Programs from the menu on the left side of the screen and click +New.
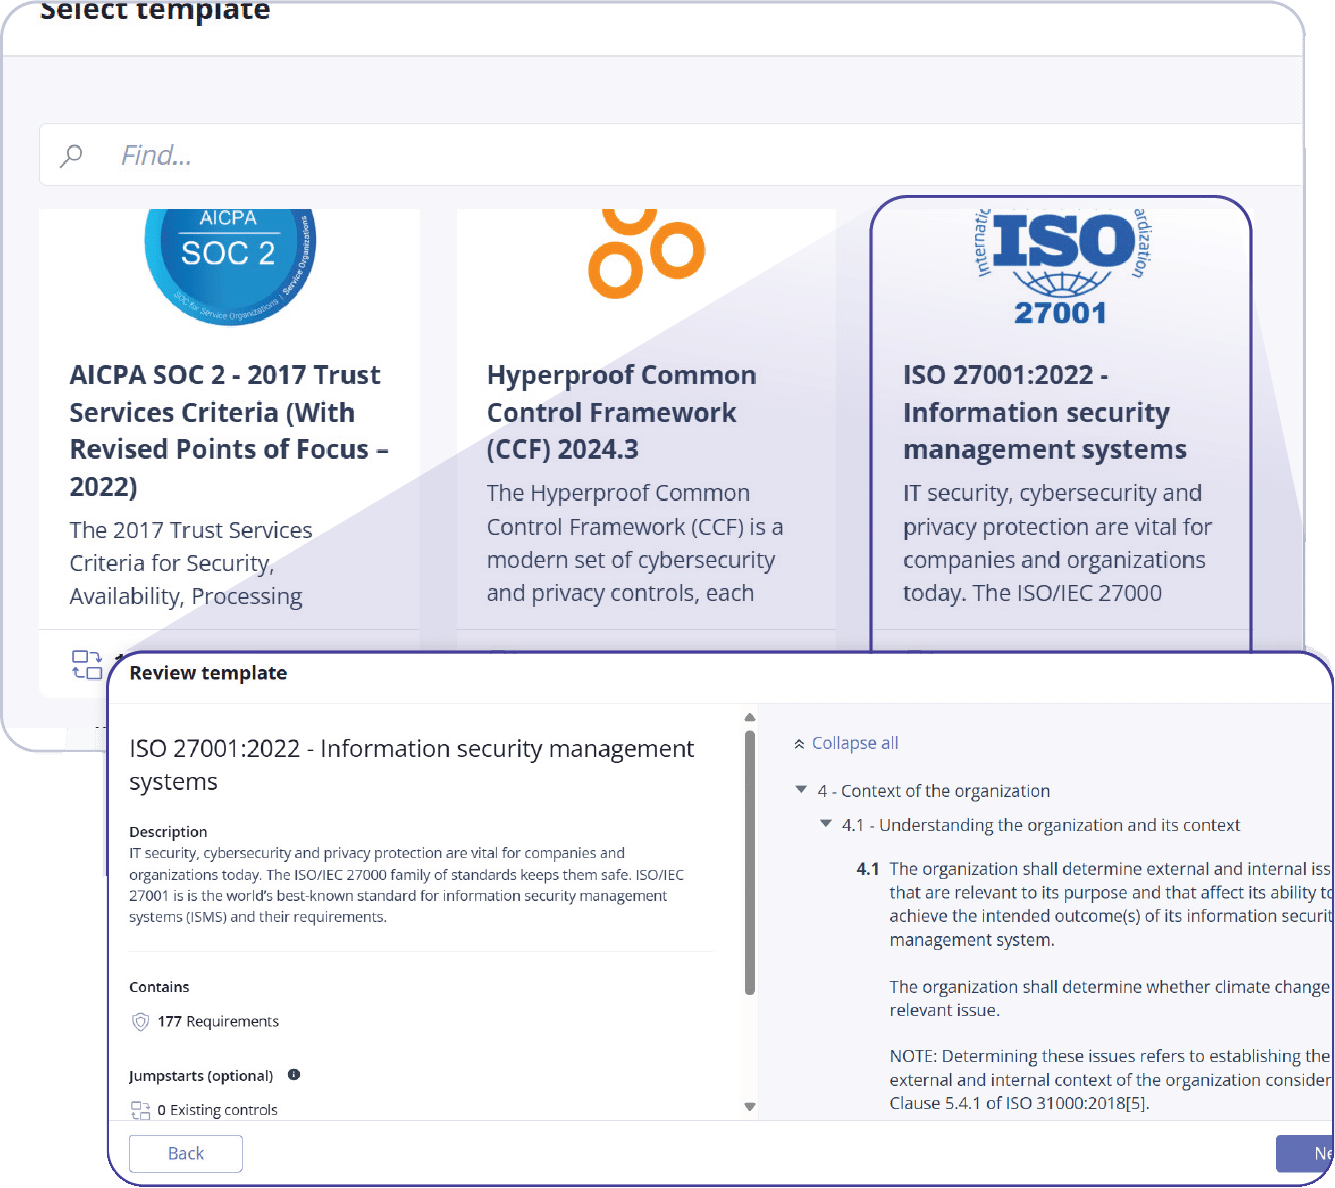
Select the template you’d like to use for the program jumpstart based on your requirements, noting that the percentages indicate how much of your existing work can be leveraged for the new framework. Click Next to continue. In this example, we’ve selected ISO 27001:2022.
Add a program name and description, confirm any acknowledgements, and click Create.
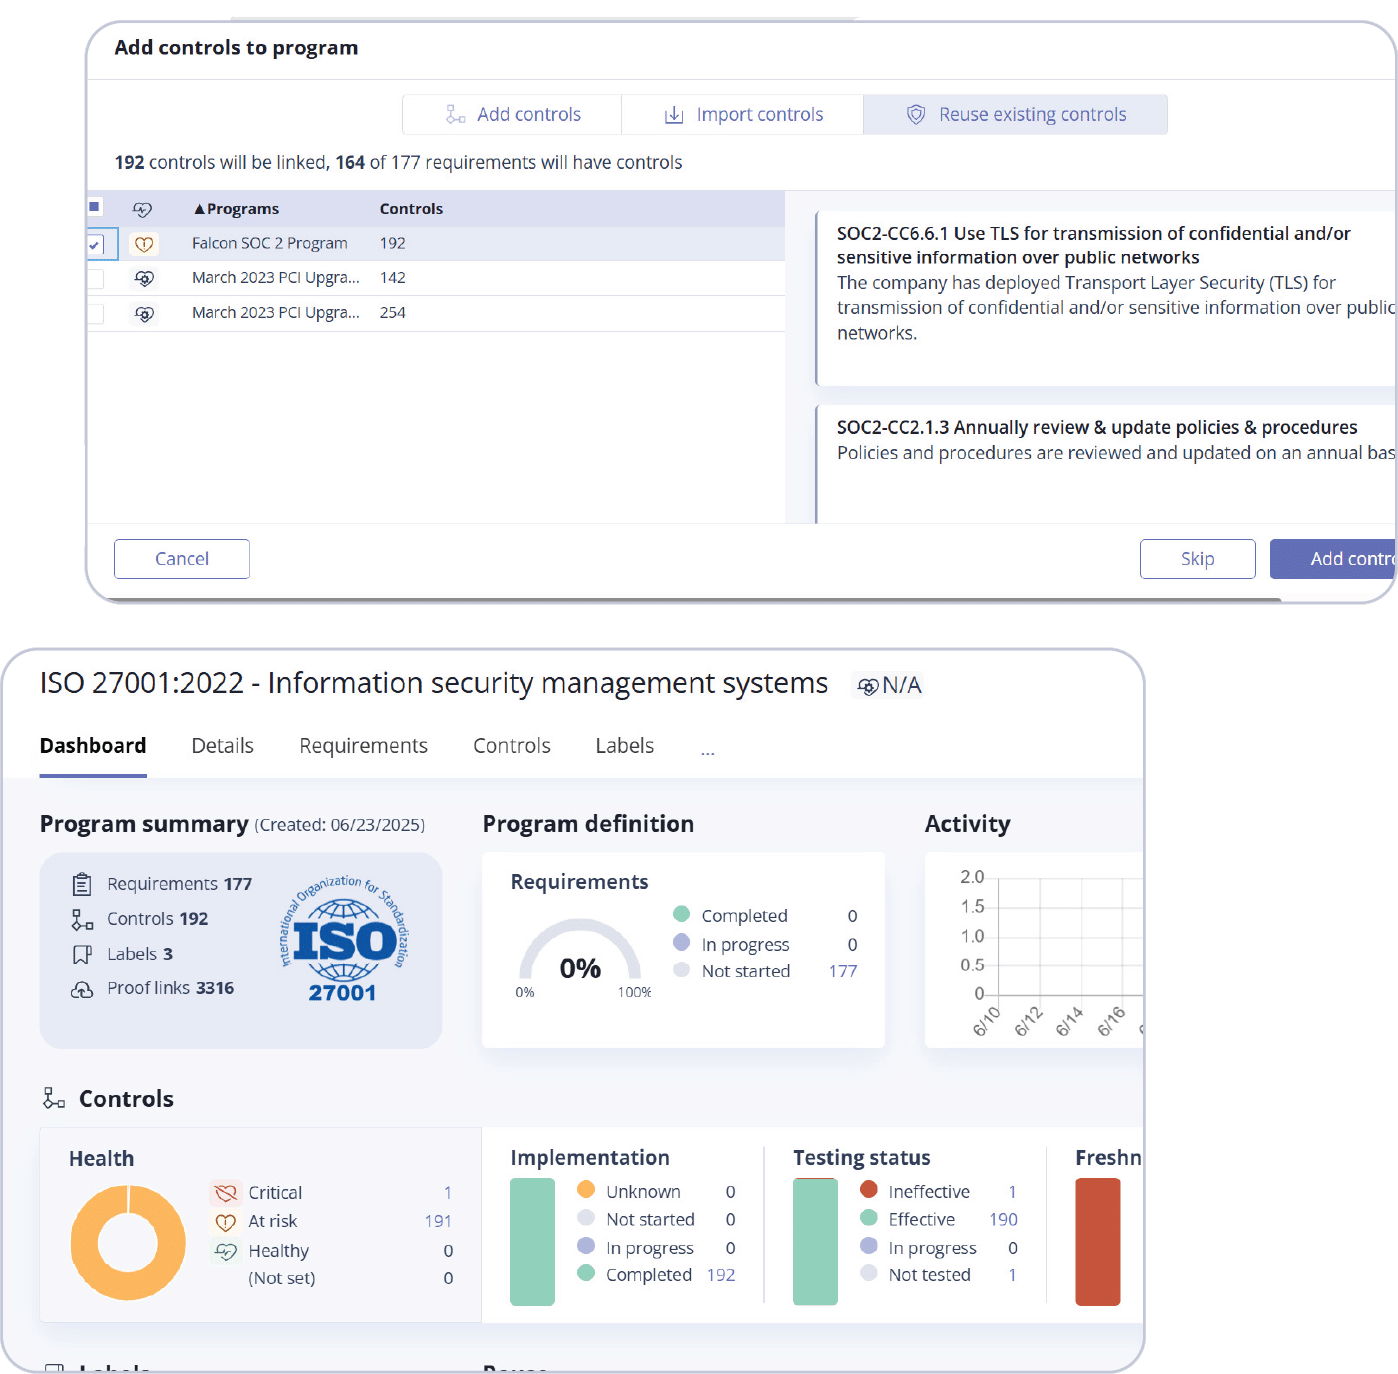
Next, you’ll want to add controls to your program. You’ll see three options: Add controls, Import controls, and Reuse existing controls. Select Reuse existing controls to take advantage of the jumpstart feature.
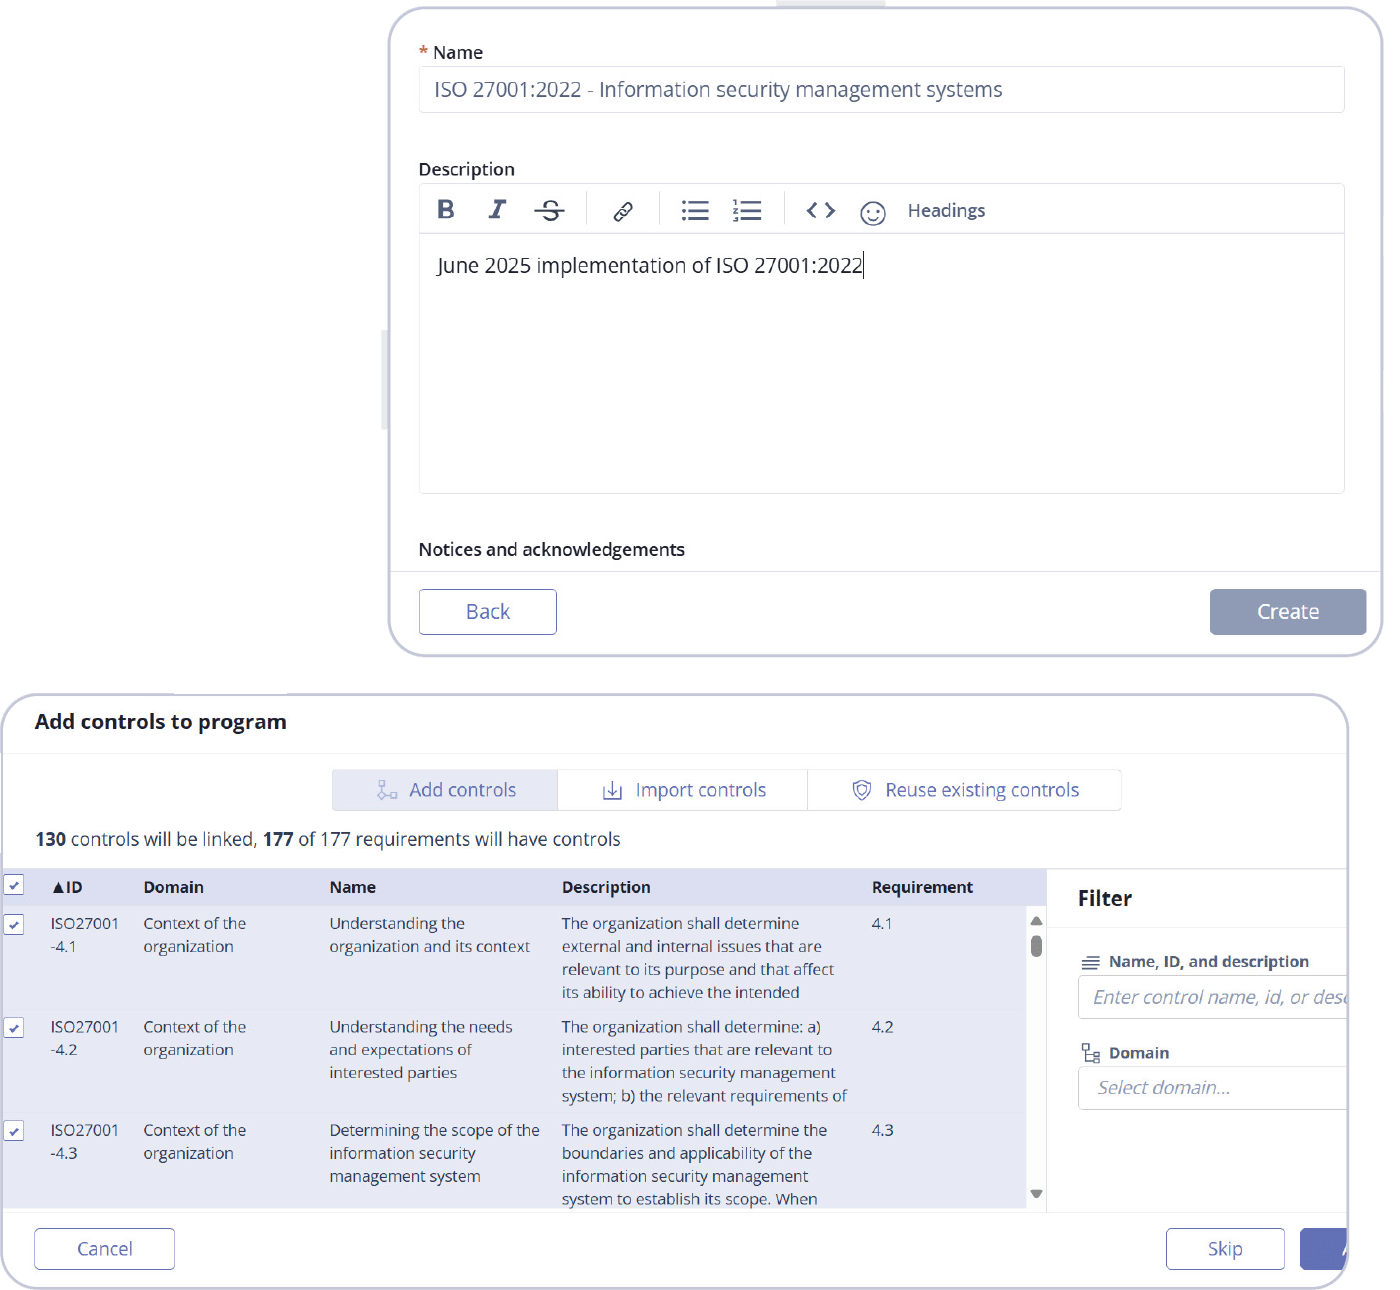
Select the programs that have controls you want to reuse by clicking the checkboxes. Once you’re finished, click Add controls.
You’ll be directed to your new framework dashboard that shows your new framework with pre-populated controls.
Now that you have an idea of how to quickly onboard new frameworks in Hyperproof, let’s take a look at our GRC deal risk and opportunity revenue impact calculator that can help you concretely quantify the financial impact of GRC has on your organization.

GRC Deal Risk and Opportunity Revenue Impact Calculator
Purpose
This calculator transforms abstract compliance metrics into concrete financial impact, enabling GRC leaders to demonstrate ROI using language that resonates in boardroom discussions. By quantifying both revenue protection and growth enablement, it positions GRC as a profit center rather than a cost center.
When to use
During budget planning cycles, when justifying GRC investments, when specific deals depend on compliance certifications, during strategic planning sessions, when exploring growth opportunities, or when evaluating the business impact of new compliance frameworks.
Deal-specific risk assessment
Current deals at risk
Track specific customers and deals that require compliance frameworks your organization hasn’t yet achieved.
|
Customer/prospect |
Deal value |
Framework required |
Deal timeline |
Risk level |
Notes |
|---|---|---|---|---|---|
|
Example: EU healthcare company |
$500,000 |
GDPR + ISO 27001 |
Q2 2025 |
High |
Contract contingent on certification |
|
Example: financial services organization |
$1,200,000 |
SOC 2® Type II |
Q1 2025 |
Important |
Preferred vendor status requires compliance |
|
Example: government agency |
$2,000,000 |
FedRAMP |
Q3 2025 |
Important |
RFP requirement |
|
Your customer 1 |
$ |
||||
|
Your customer 2 |
$ |
||||
|
Your customer 3 |
$ |
Total revenue at risk: $______
Framework investment analysis
For each required framework, calculate the investment needed and potential return.
|
Framework |
Investment cost |
Timeline to compliance |
Deals enabled |
Total deal value |
ROI |
|---|---|---|---|---|---|
|
GDPR |
$75,000 |
6 months |
3 deals |
$850,000 |
1,033% |
|
SOC 2® Type II |
$120,000 |
8 months |
5 deals |
$2,100,000 |
1,650% |
|
ISO 27001 |
$150,000 |
12 months |
4 deals |
$1,800,000 |
1,100% |
|
Framework 1 |
$ |
deals |
$ |
% |
|
|
Framework 2 |
$ |
deals |
$ |
% |
Customer retention risk analysis
Identify existing customers whose renewals depend on maintaining or achieving compliance.
|
Existing customer |
Annual value |
Framework requirement |
Compliance status |
Retention risk |
Action needed |
|---|---|---|---|---|---|
|
Example: global bank |
$800,000 |
PCI DSS Level 1 |
6 months to expiry |
High |
Immediate renewal |
|
Example: insurance firm |
$600,000 |
SOX compliance |
Compliant |
Low |
Monitor changes |
|
Customer 1 |
$ |
||||
|
Customer 2 |
$ |
Total annual revenue at risk: $______
Strategic market entry opportunity assessment
Process overview
Step 1: Identify target markets and requirements
Step 2: Assess current compliance capabilities
Step 3: Calculate business opportunity
Step 4: Develop an action plan
Market opportunity matrix
|
Target market |
Framework required |
Market size |
Expected market share |
Timeline |
Revenue projection |
|---|---|---|---|---|---|
|
EU healthcare |
GDPR + ISO 27001 |
$50M |
2% |
18 months |
$1,000,000 |
|
US government |
FedRAMP |
$200M |
0.5% |
24 months |
$1,000,000 |
|
Financial services |
SOC 2 Type II |
$30M |
5% |
12 months |
$1,500,000 |
|
Market 1 |
$ |
% |
months |
$ |
|
|
Market 2 |
$ |
% |
months |
$ |
Total new market opportunity: $______
Investment prioritization matrix
|
Target market |
Required frameworks |
Gap analysis |
Market size |
Expected market share |
Time to compliance |
Revenue projection |
Competitive advantage |
Priority ranking |
|---|---|---|---|---|---|---|---|---|
|
EU healthcare |
GDPR + ISO 27001 |
Missing: data residency, privacy assessments |
$50M |
2% |
18 months |
$1,000,000 |
12-month head start |
High |
|
US government |
FedRAMP |
Missing: continuous monitoring, incident response |
$200M |
0.5% |
24 months |
$1,000,000 |
6-month advantage |
Medium |
|
Financial services |
SOC 2® Type II |
Ready to implement |
$30M |
5% |
12 months |
$1,500,000 |
Market entry enabled |
High |
|
Market 1 |
$ |
% |
months |
$ |
||||
|
Market 2 |
$ |
% |
months |
$ |
||||
|
Market 3 |
$ |
% |
months |
$ |
Total new market opportunity: $______
Executive summary calculations
Total revenue at immediate risk: $_________________
Total annual retention risk:
$_________________
Total new market opportunity: $_________________
Combined revenue impact:
$_________________
Total framework investment: $_________________
Overall ROI:
_________________%
Implementation instructions
- Gather sales team input on specific deals requiring compliance frameworks
- Identify renewal risks from existing customers with compliance requirements
- Research market opportunities in regulated industries that these frameworks would unlock
- Calculate timeline urgency based on deal closing dates and compliance achievement timelines
- Present to leadership with specific customer names and dollar amounts to maximize impact
- Update quarterly as new deals emerge and compliance status changes
Action Items
Based on your analysis:
Immediate actions (next 30 days):
Medium-term actions (3-6 months):
Long-term actions (6+ months):
Cost avoidance vs. revenue generation in GRC valuation
GRC initiatives typically deliver value through both preventing losses and creating gains. Balancing these perspectives in financial analyses helps create a more comprehensive understanding of GRC’s business contribution.
Cost avoidance represents the traditional value proposition of GRC programs. Quantifying potential losses prevented through effective risk management might include calculating the expected costs of:
Historical data, industry benchmarks, and probability-weighted scenarios help establish reasonable estimates for these avoided costs.
Revenue generation potential often receives less attention but represents a growing focus for mature GRC programs. Business acceleration benefits might include:
Market access benefits highlight revenue opportunities from entering regulated markets that would otherwise be inaccessible without strong compliance capabilities.
A balanced valuation framework incorporates both perspectives. Organizations should consider developing risk-adjusted revenue forecasts that account for both downside protection and upside potential. Scenario planning exercises that model business outcomes with and without specific GRC capabilities help quantify the full spectrum of financial impacts.
Communication strategies for different stakeholders may emphasize different aspects of this valuation. Executive leadership often responds to revenue generation potential, while risk and audit committees might focus on cost avoidance. A comprehensive story that connects both perspectives to your overall business strategy tends to resonate most effectively across stakeholder groups.
Building financial models that connect GRC to shareholder value
Sophisticated financial modeling can help to demonstrate GRC’s contribution to long-term shareholder value, moving beyond short-term cost-benefit analyses to show strategic impact. These models connect GRC investments to the fundamental drivers of enterprise value.
Revenue impact modeling: This examines how GRC initiatives affect top-line growth, including analyzing the revenue protected by preventing business disruptions, additional revenue enabled by compliance-dependent market entry, and increased customer acquisition and retention due to enhanced trust and reputation. Organizations can integrate these projections into overall revenue forecasts, highlighting GRC’s contribution to growth targets.
Cost structure modeling: GRC automation and process improvements often reduce compliance costs over time, while effective risk management limits unexpected expenses from incidents and penalties. Models might track the efficiency ratio of compliance spending relative to revenue or assets, demonstrating improved return on GRC investments as programs mature.
Risk premium reduction: Strong GRC programs potentially reduce capital costs by lowering perceived business risk among investors and lenders. Financial models can estimate this impact by analyzing changes in debt costs, equity valuations, and insurance premiums as GRC capabilities mature. Integration with standard financial metrics helps communicate this value effectively.
Organizations might connect GRC metrics to earnings before interest, taxes, depreciation, and amortization (EBITDA) impacts, return on invested capital improvements, or economic value added calculations. These connections translate GRC performance into language familiar to financial analysts and investors.
How to get real-time visibility with Hyperproof
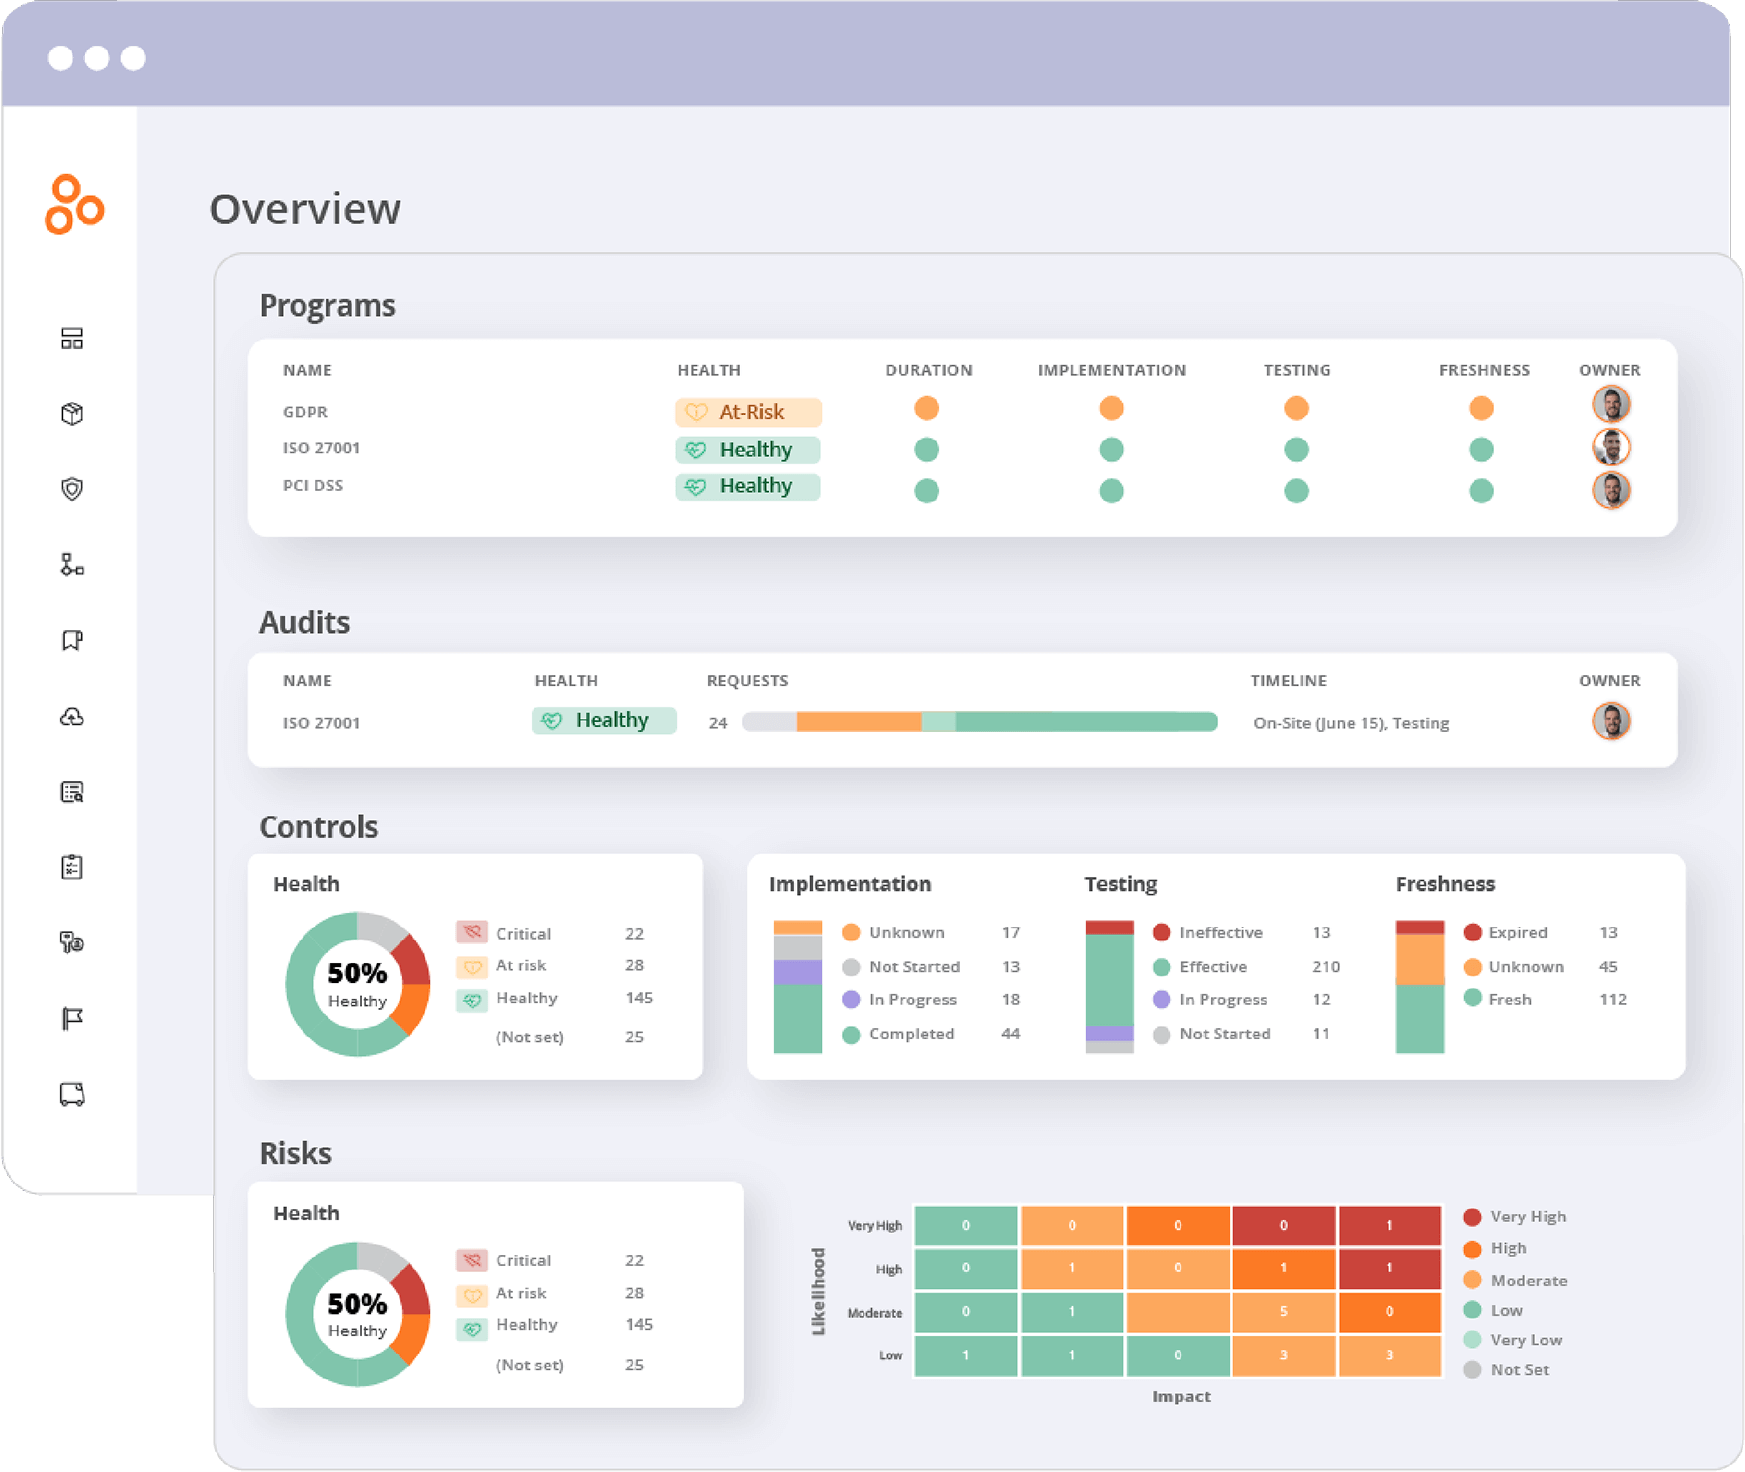
Hyperproof’s dashboard capabilities support this modeling by providing real-time visibility into compliance status, control effectiveness, and resource allocation. This data can be used as inputs for financial models, strengthening the connection between GRC performance and business outcomes while allowing for regular updates based on actual results.
For an overview of your overall program health, click Overview.
By comparison, to see the health of an individual program, click on the program name:
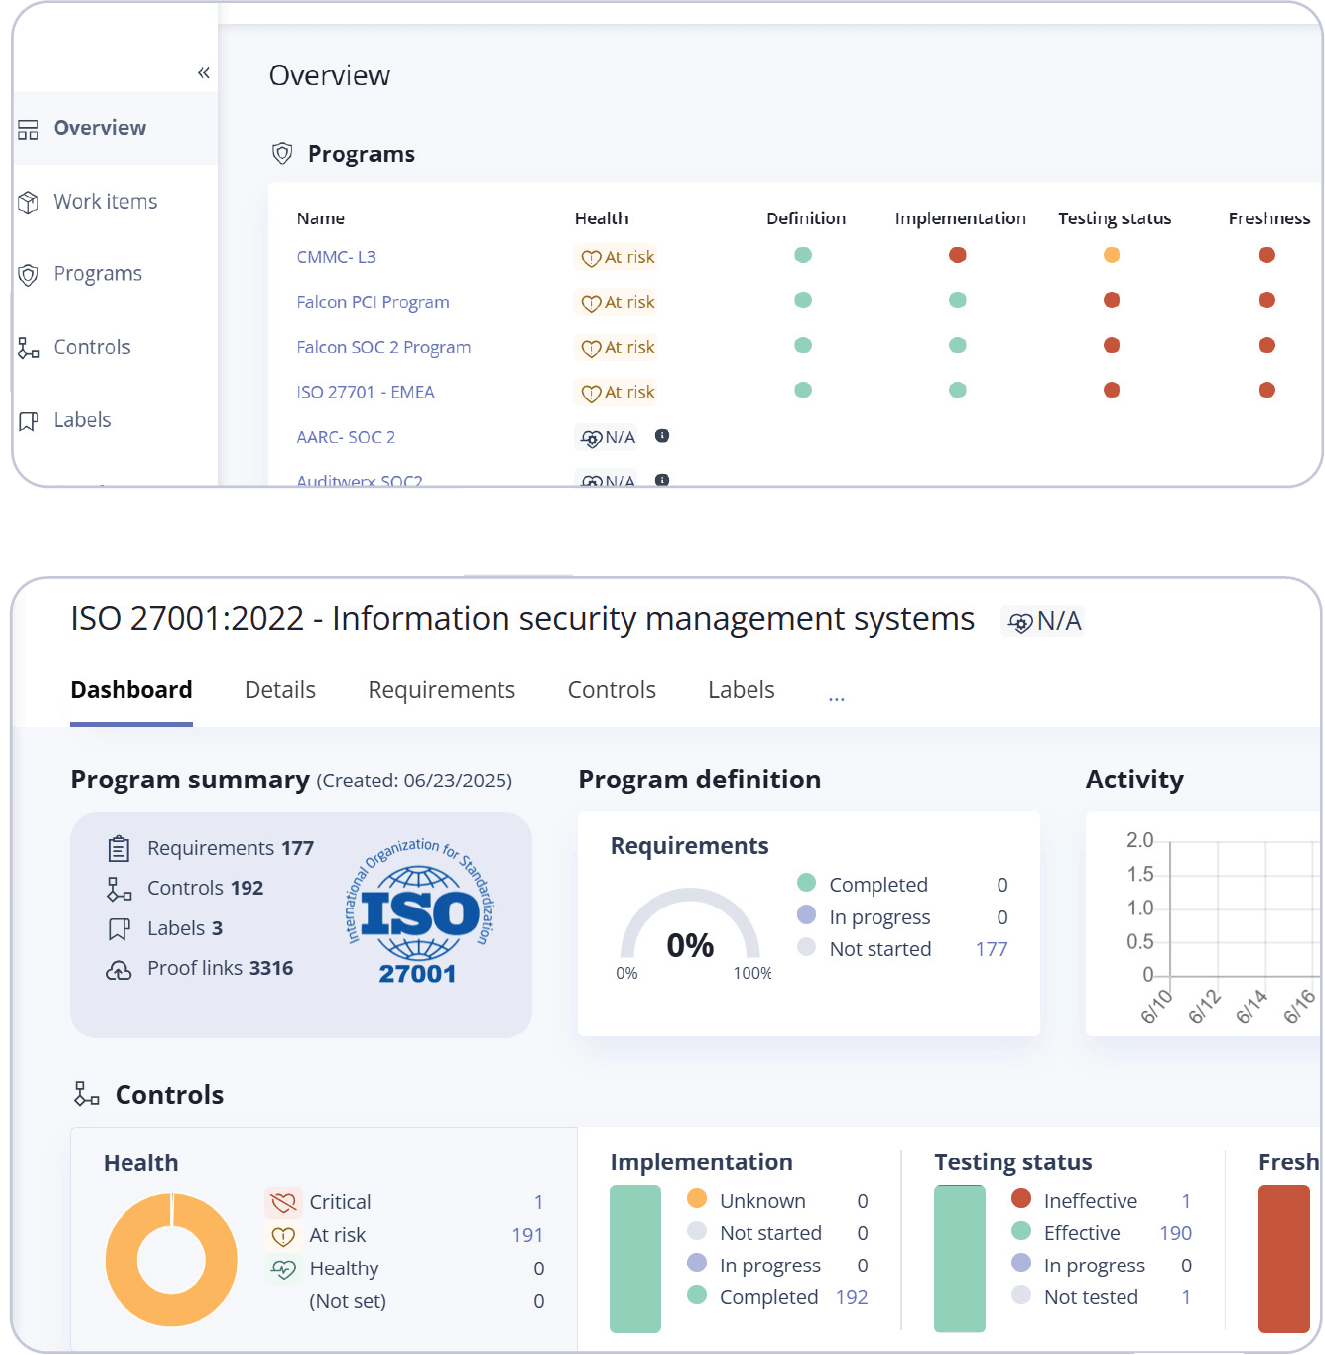
In both cases, Hyperproof provides details of the program’s definition, implementation, testing status, and freshness:
Program definition:
Completed
Indicates the number of requirements in the program that have been fully completed.
In progress
Shows the number of requirements that are currently being worked on.
Not started
Represents the number of requirements that have not yet been started.
Not applicable
Indicates the number of requirements that are irrelevant to the program.
Program implementation
Not started
The implementation process for the program’s requirements has not yet begun. Requirements in this state have not been worked on.
In progress
The requirements are currently being worked on, indicating that implementation activities are underway but not yet complete.
Completed
The requirements have been fully implemented, meaning all necessary actions have been taken to satisfy the requirement.
Not applicable
The requirements are deemed irrelevant to the program and do not require implementation
Testing status
The overall health of the control may change depending on the selected status. A status of ‘not tested’ or ‘in progress’ puts the control ‘at risk’. A status of ‘ineffective’ causes the overall health to default to ‘critical’, even if the control is otherwise fresh, implemented, and has linked proof.
Not tested
The control has not yet been tested. This is the default status.
In progress
The control is actively undergoing testing.
Effective
The control is functioning as intended, and the associated risk is low.
Ineffective
The control has a weakness that needs to be addressed, indicating high risk. When set to ineffective, two deficiency properties become available: design and operation.
Freshness
These statuses are visible throughout
Hyperproof, including dashboards and work
items, and are used to notify users about the
state of controls and labels.
Fresh
The control or label is up-to-date and in compliance with program requirements. This status remains until the expiration period defined by the freshness policy ends.
Expired
The expiration period has ended, so the status changes to Expired. This signals that the control or label needs to be revisited, and any linked proof may need updating to maintain compliance.
Unknown
The system cannot determine the current state of freshness, or freshness has not been set for the control or label.
Not set
No freshness policy has been applied to the control or label.

Communicating GRC value to executive leadership
Translating technical GRC language into business terms
Effective communication with executive leadership requires converting complex GRC concepts into business language that resonates with decision-makers. This translation process helps secure support for GRC initiatives by demonstrating their alignment with strategic business priorities.
GRC-to-business language translation guide
|
Technical GRC term |
Business translation |
Executive impact |
|---|---|---|
|
Control frameworks |
Business protection systems |
Safeguards revenue and operations |
|
Compliance requirements |
Market access standards |
Enables entry into regulated markets |
|
Vulnerability management metrics |
System reliability indicators |
Prevents costly downtime and breaches |
|
Penetration testing |
Customer data breach prevention |
Protects reputation and prevents customer exodus |
|
Access control implementation |
Intellectual property protection |
Maintains competitive advantage |
|
Security incident metrics |
Financial loss prevention statistics |
Quantifies avoided costs and damages |
|
Compliance achievement percentages |
Market access readiness indicators |
Shows ability to capture new opportunities |
|
Risk assessment findings |
Business threat analysis |
Identifies obstacles to growth objectives |
|
Control effectiveness testing |
System performance validation |
Ensures operational reliability |
|
Remediation timelines |
Risk mitigation schedules |
Demonstrates proactive problem-solving |
|
Framework maturity levels |
Business protection capability |
Shows organizational security strength |
|
Audit findings |
Improvement opportunities |
Highlights areas for operational enhancement |
Usage guidelines

This table provides an immediate reference for GRC professionals to communicate more effectively across the organization, transforming technical concepts into language that resonates with business stakeholders.
Avoiding jargon and acronyms without explanation prevents communication barriers. When technical terms remain necessary, brief explanations create shared understanding. Focusing on outcomes rather than processes keeps communication relevant to executive interests.
Creating executive dashboards that connect GRC to business performance
Effective executive reporting links GRC activities directly to business outcomes through carefully designed dashboards and visualizations. These tools translate complex risk and compliance data into actionable business insights for leadership teams.
Key components of effective GRC dashboards include:

Trend analysis provides context for current performance. Historical comparisons show progress over time on key metrics, helping executives understand improvement trajectories. Industry benchmarking places organizational performance in a competitive context, highlighting areas of advantage or concern. Forecasting elements project future risk scenarios and compliance requirements, supporting proactive decision-making.
Design principles for these dashboards should emphasize:
Hyperproof’s dashboard capabilities help to support this executive communication by providing comprehensive visibility into compliance status, control effectiveness, and resource allocation. These real-time insights help GRC leaders demonstrate business impact while enabling adjustments to changing conditions or priorities.

Determining appropriate budget allocation for revenue-supporting GRC initiatives
Organizations can use several frameworks to compare their GRC investments against other business priorities and make informed allocation decisions.
Investment frameworks
1. Risk-based budget allocation
This connects investment levels to the risk exposure they address and helps ensure proportional investment relative to the magnitude and likelihood of potential losses. Organizations might:
2. Revenue protection analysis
This examines how GRC investments protect existing revenue streams. Quantifying the revenue at risk without adequate controls provides a ceiling for reasonable investment levels. Organizations can:
3. Market enablement valuation
This analysis focuses on new revenue opportunities enabled by GRC capabilities and helps justify investments based on growth potential rather than just risk reduction. Organizations might:

4. Resource optimization models
These models examine how GRC investments improve overall resource utilization. Efficiency gains provide additional return on GRC investments beyond direct risk reduction. Benefits include:
5. Comparative investment analysis
These comparisons help ensure that GRC initiatives receive appropriate consideration in resource allocation decisions. They evaluate GRC initiatives against other business investments using consistent financial metrics. Methods include:

Aligning GRC reporting with financial reporting cycles
Integrating GRC value reporting with established financial reporting processes increases its visibility and relevance to executive leadership. This alignment helps GRC professionals coordinate their communications with accounting cycles and investor relations activities.
Synchronizing reporting calendars
Organizations might schedule major GRC performance reviews to coincide with quarterly financial close processes. Annual GRC strategy and budget planning can align with the organizational budgeting cycle. This synchronization ensures that GRC information is available when key financial and strategic decisions are made.
Coordinated metrics and KPIs
Strengthen the connection between GRC and financial performance by developing GRC metrics that directly support or explain specific financial results. Examples include:
These connections help financial analysts understand how GRC activities contribute to reported results.
Integrated reporting formats present GRC information alongside relevant financial data. Executive dashboards might display GRC performance indicators next to the financial metrics they influence. Board presentations can include GRC updates within business performance sections rather than as separate compliance reports. This integration reinforces the business relevance of GRC activities.
Collaborative review processes involving both GRC and finance teams improve reporting quality. Joint reviews of draft reports help identify connections between GRC activities and financial outcomes. Shared analysis of performance trends and anomalies provides deeper insights into causal relationships. These collaborations build mutual understanding between GRC and finance functions.
Regular communication between GRC leaders and investor relations teams ensures consistent external messaging about risk management and compliance capabilities. This alignment helps the organization present a coherent narrative to external stakeholders about how GRC activities support business performance and long-term value creation.
Implementing a revenue-focused GRC program

Methods to identify and eliminate redundancies across multiple cybersecurity frameworks
Organizations implementing multiple cybersecurity frameworks often encounter overlapping requirements, duplicated processes, and unnecessary complexity. Identifying and eliminating these redundancies reduces operational costs while maintaining comprehensive coverage, freeing resources for revenue-generating activities.
Framework review and control mapping
A comprehensive framework review and control mapping process provides the foundation for redundancy identification. Organizations should thoroughly review each cybersecurity framework to understand specific requirements and controls. Creating a matrix that aligns controls from different frameworks side-by-side highlights overlapping or redundant elements, making it easier to identify where similar requirements appear multiple times across frameworks.
Centralized management and automation
Centralized management systems and automation tools streamline control implementation and monitoring. Using a GRC platform that integrates multiple frameworks allows unified tracking, reporting, and management of controls. Automation tools can identify, manage, and report on controls across frameworks, reducing manual effort and minimizing errors. These systems flag duplicate evidence requests or overlapping assessment activities, preventing wasted effort.
Standardization of processes and documentation
Standardization of assessment processes and documentation further reduces duplication. Developing standardized templates and checklists for control assessments that apply across frameworks ensures consistency and reduces redundant work. Automated assessment tools can analyze compliance data from multiple frameworks simultaneously, highlighting opportunities for consolidation.
Training GRC teams to think in revenue terms
Developing business acumen among GRC professionals transforms their perspective from purely technical or compliance-focused to revenue-aware. This shift enables more strategic contributions and better alignment with organizational priorities.
Key training areas
Fundamental business education
GRC teams benefit from training in basic financial concepts, revenue models, and profit drivers specific to their organization. Understanding the company’s business model, competitive landscape, and growth strategy provides essential context for GRC decisions. Industry-specific training helps teams grasp unique revenue considerations in their particular sector.

Cross-functional exposure
Rotation programs or shadowing opportunities with sales, marketing, and product teams help GRC professionals understand front-line business operations. Participation in customer meetings (where appropriate) provides insight into client priorities and concerns. Joint projects with business units create opportunities to apply GRC expertise in business contexts.
Revenue impact analysis skills
Training in cost-benefit analysis, return on investment calculation, and business case development builds capability to articulate value propositions. Scenario planning exercises that explore the business impacts of various risk and compliance decisions develop strategic thinking skills. Workshops on quantifying both tangible and intangible benefits of GRC initiatives improve value communication.
Outcome-based thinking
Reframing GRC objectives in terms of business outcomes rather than compliance requirements changes perspective. Emphasizing how risk management and compliance enable business growth rather than just prevent problems creates a more positive orientation. Recognizing and celebrating GRC contributions to successful business initiatives reinforces this mindset.
Communication skills development
Presentation training helps GRC professionals explain complex topics in accessible language. Storytelling workshops teach how to craft compelling narratives about GRC value. Executive communication coaching prepares teams for interactions with senior leadership.
Integrating GRC into business planning and budgeting processes
Embedding GRC considerations into organizational planning and resource allocation ensures alignment with business priorities from the earliest stages. This integration helps position GRC as a strategic business function rather than a separate compliance activity.
Integrated business case development
Coordinated budgeting processes
Shared metrics and performance indicators
Creating sustainable GRC value
Successful transformation of GRC from a compliance necessity to a strategic business function requires sustained commitment and continuous evolution. Organizations that achieve this recognize that GRC can contribute meaningfully to revenue generation, competitive differentiation, and long-term business success.
The journey begins with changing perceptions about GRC’s purpose and potential, including finding the right balance between revenue focus and risk management. By identifying direct and indirect revenue impacts of GRC activities and overcoming organizational barriers to integration, companies lay the foundation for a more strategic approach.
Building an integrated GRC value chain and mapping specific activities to revenue-generating functions creates structural alignment between compliance efforts and business objectives. Risk-based prioritization ensures resources flow to initiatives with the greatest potential impact, while optimization of existing controls and frameworks delivers value without additional investment.

Quantifying the financial impact of GRC initiatives through appropriate metrics and valuation approaches helps communicate this value to stakeholders. By distinguishing between cost avoidance and revenue generation and developing financial models that connect GRC to shareholder value, organizations demonstrate the comprehensive business contribution of these activities.
Leveraging GRC as a competitive advantage requires:
Highlighting customer-facing benefits in sales conversations and building trust capital through transparency transforms compliance from a requirement into a selling point.
Effective communication with executive leadership depends on:
These practices secure support for GRC initiatives by demonstrating their business relevance.
Implementing a revenue-focused GRC program involves:
The ultimate goal is to create a sustainable approach where GRC continuously contributes to organizational success. By embedding GRC considerations into strategic decision-making, operational processes, and customer relationships, organizations transform compliance from a periodic exercise into an ongoing source of competitive advantage and business value.
Download the PDF